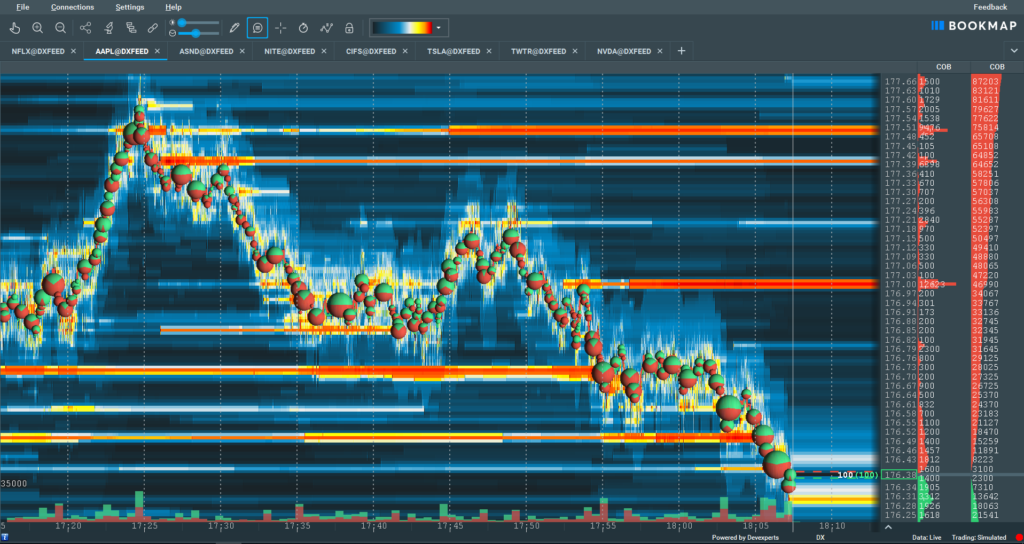
Bookmap: A trading platform that displays market liquidity
What is Bookmap?
Bookmap trading platform accurately shows the entire market liquidity and trading activities. Identify market trends & hidden price patterns with high precision.
The heatmap shows the historical limit order book (historical liquidity).
Watch the traded volume and identify the side in control by using Volume Delta, Advance Volume Profiles, and Cumulative Volume Delta tools.
Based on traders’ requests and Bookmap’s expertise in HFT trading, Bookmap developers have created a unique set of indicators that add transparency and cover most of traders’ needs.

Students of Cyber Trading University are already starting to use this awesome platform to enhance their trading in the CyberGroup Trading Room.
With Bookmap, any change in the order book — placement, change, cancellation, or execution — is displayed on the chart as Heatmap view.
The more limit orders placed on a certain level, the brighter the level displayed on the map. Thus, the trader sees the full picture of the market, the current mood and the intention of other participants in the trading process.
What makes Bookmap so valuable for a traders? Because of its unique market data visualization and analysis tool set. It includes instruments that give you an advantage in the market, providing clarity on what’s happening so that you can make better decisions. Using the right tools and continuously improving your skills will win you this game called trading.
In-depth Data Visualization with Bookmap
Bookmap’s heatmap and volume dot features allow you to see the limit and market orders being issued on the exchange. The limit orders are revealed through the heatmap and market orders are shown through volume dots.
With these features you can…
- Identify liquidity levels and patterns
- Observe the intentions of other market participants
- Find the most active price levels
- See market dynamics and define the market state